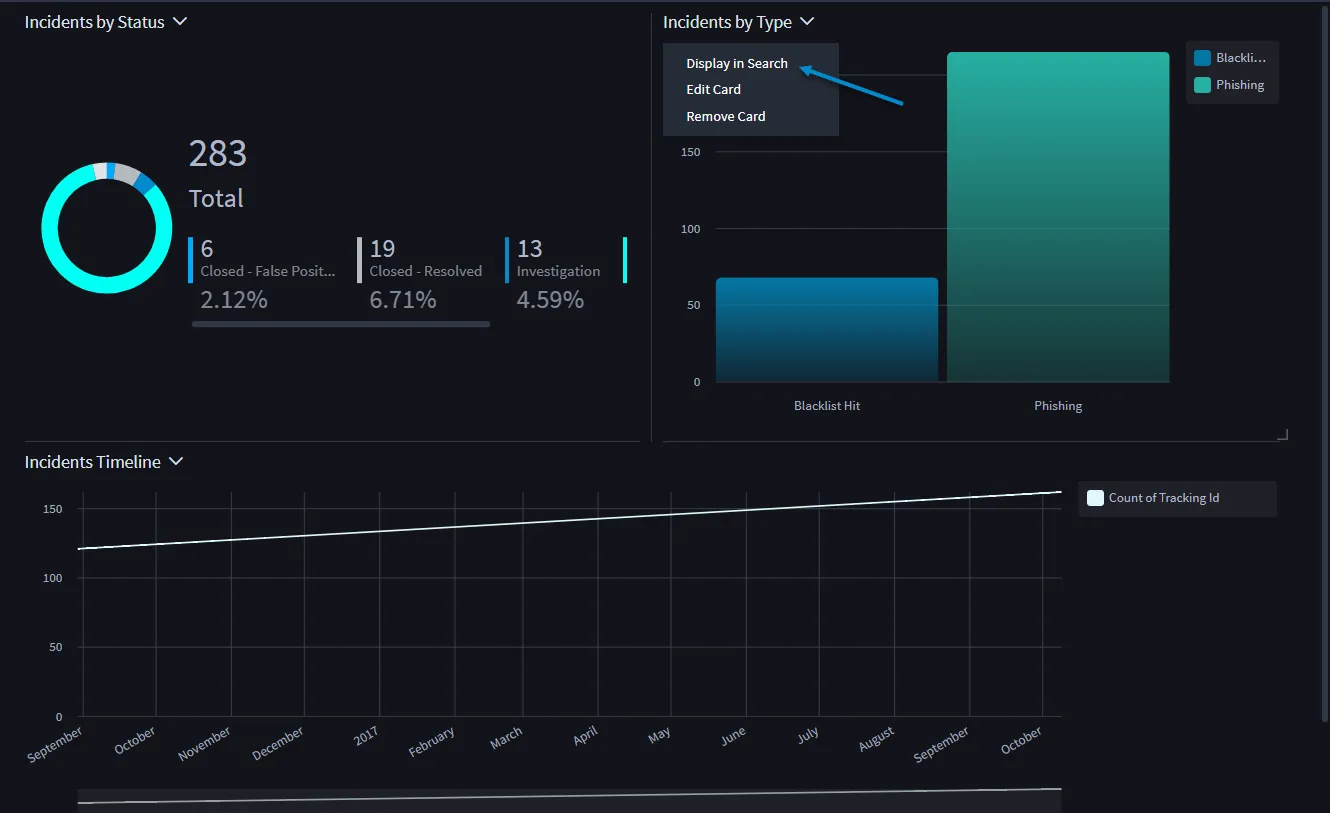
Charts
You can visualize data and create reports with charts.
To view charts:
Open the Default Report (or any report) view of Application Records.
Click Charts on the Default Report taskbar.
- The visualization panel is split into two parts: chart configuration on the left and preview on the right.
To create a visualization, select the desired chart type. Chart types are listed above the chart preview, and are grouped into categories.