Chart Types
This topic contains chart type examples.
Bar Charts
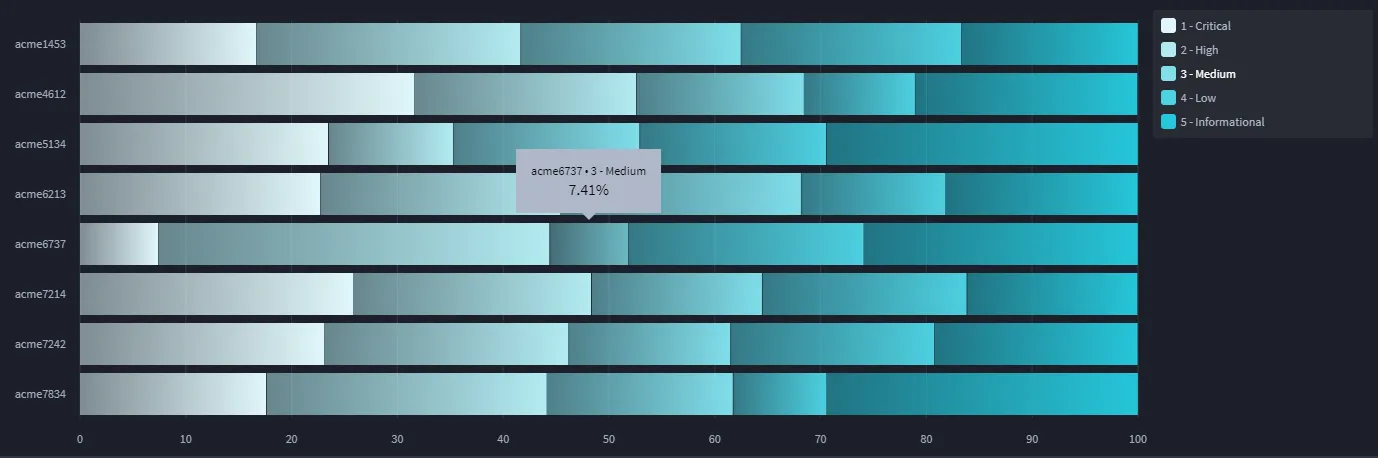
Use bar charts to show comparisons between different categories of data. The bars can display either vertically or horizontally.
Vertical Bar
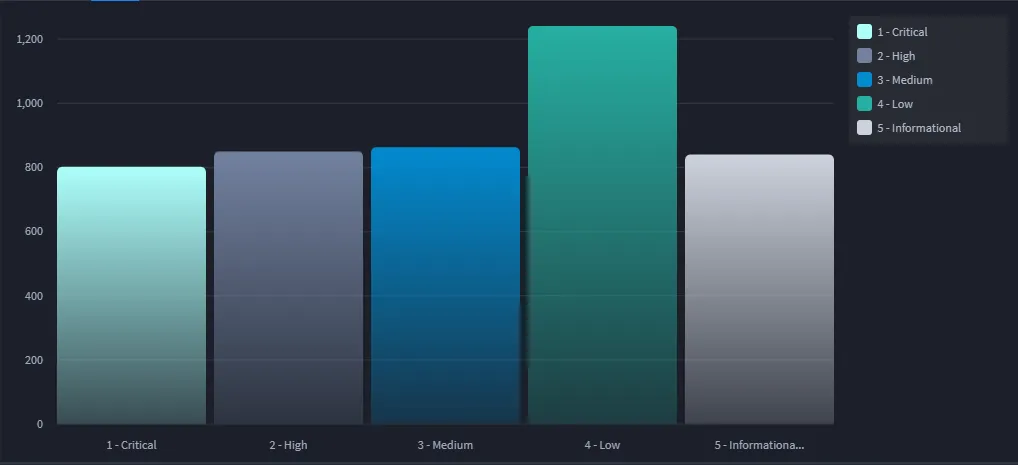
Grouped Vertical Bar
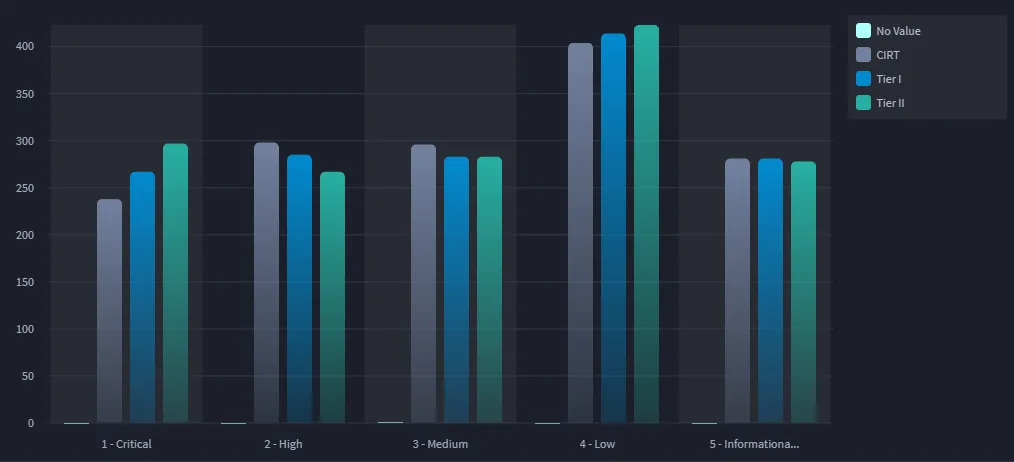
Stacked Vertical Bar
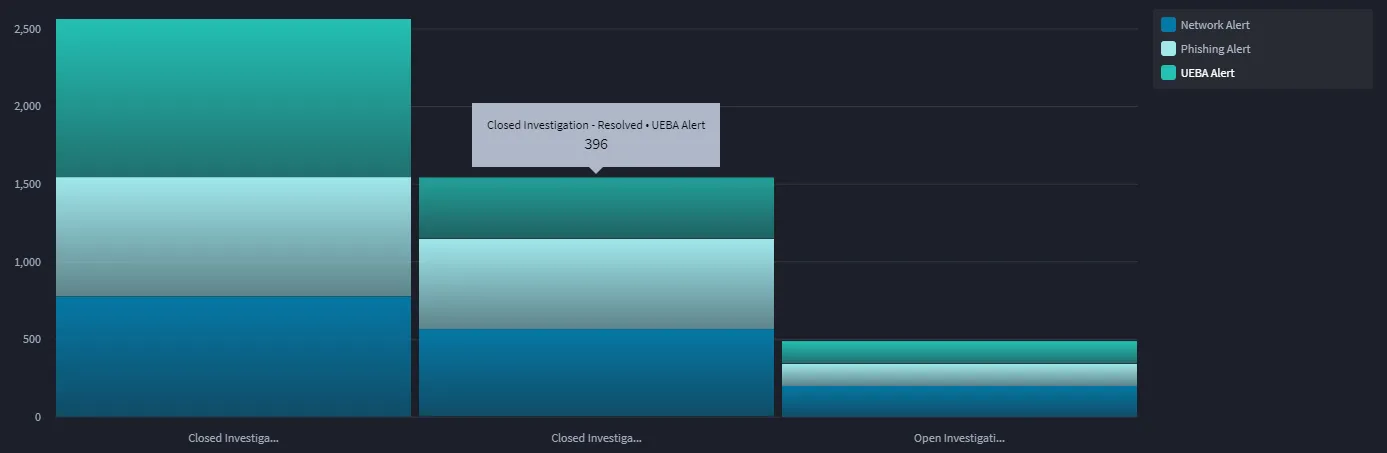
100% Vertical Bar
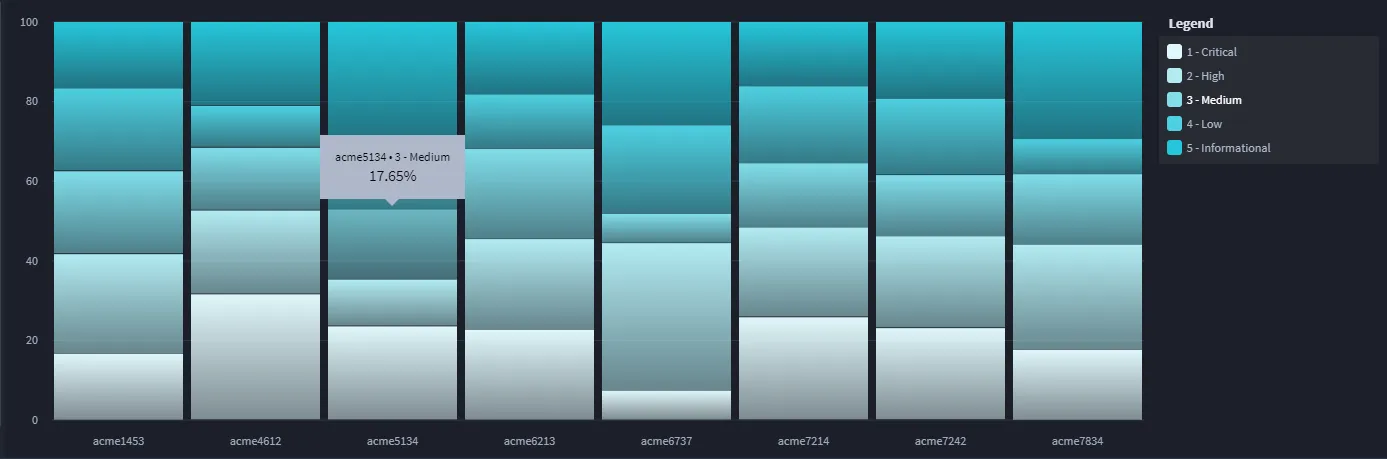
Horizontal Bar
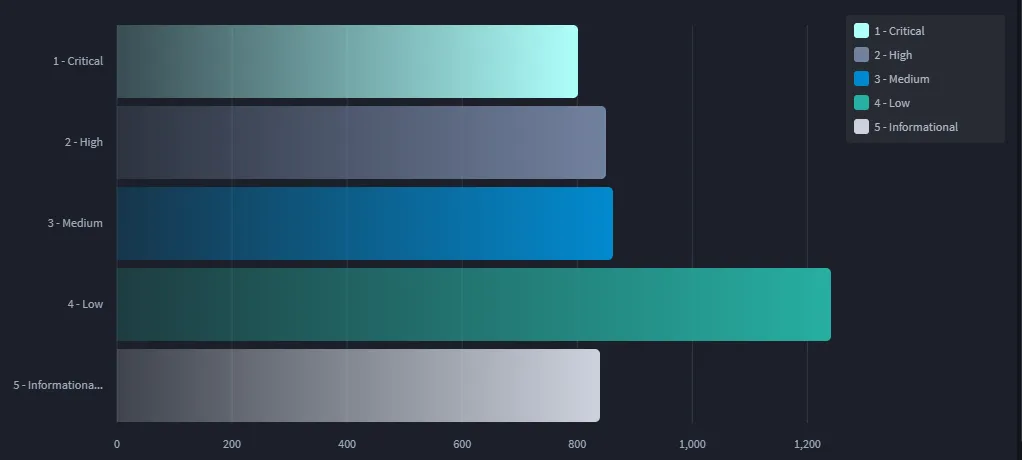
Grouped Horizontal Bar
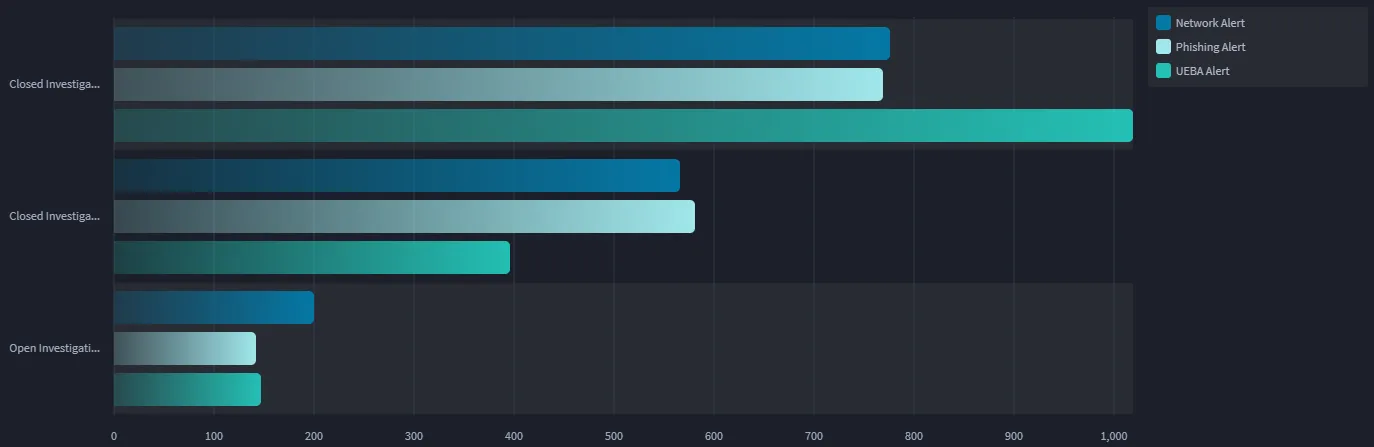
Stacked Horizontal Bar
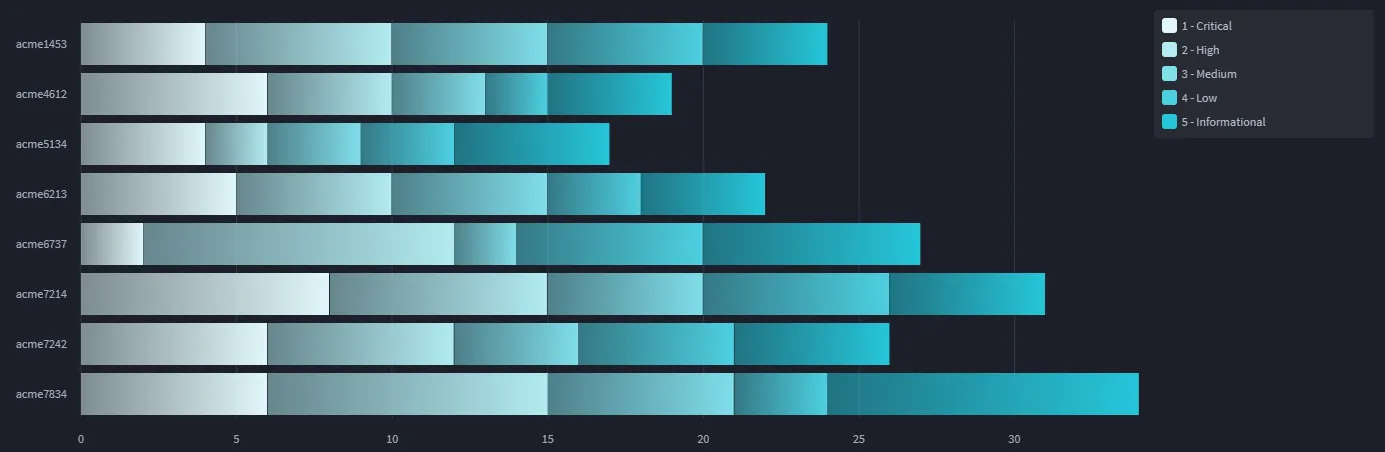
100% Horizontal Bar
Line Charts
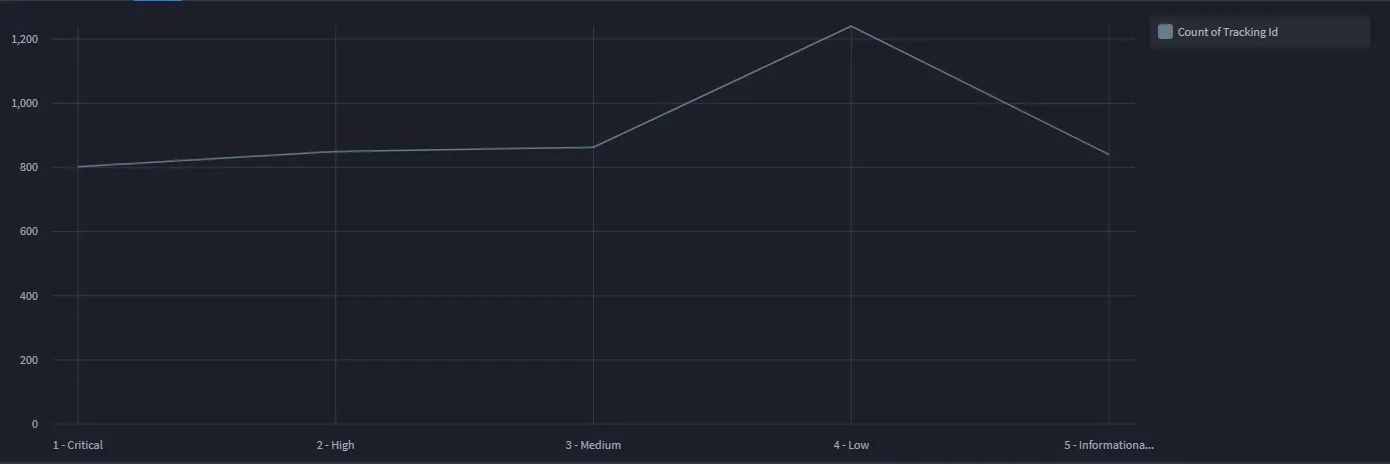
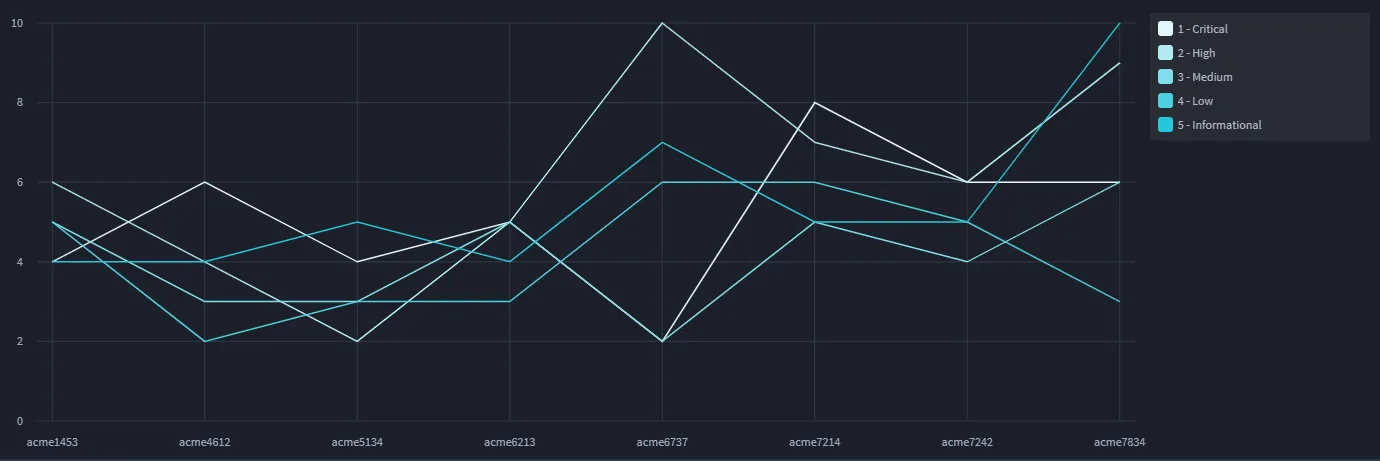
Use line charts when you want to represent continuous data in a chart. Line charts work well with time data, but can also be used for other types of continuous data such as levels or distances.
Line
Multi-Series Line
Radar Charts
Use radar charts to display multivariate data in a two-dimensional format. The variables (3 or more) are typically represented on axes starting from the same point.

Area Charts
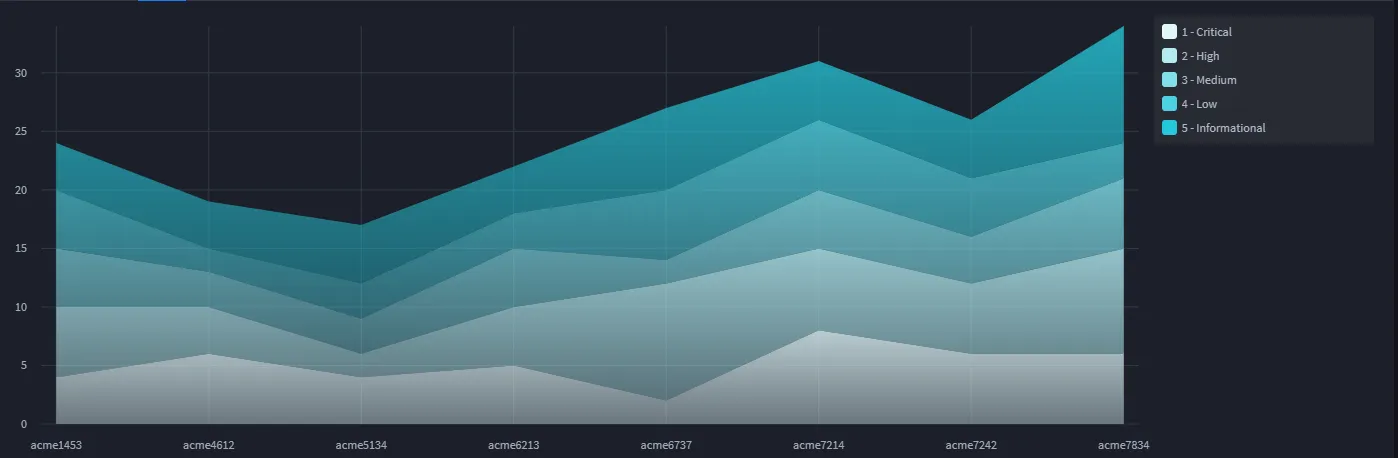
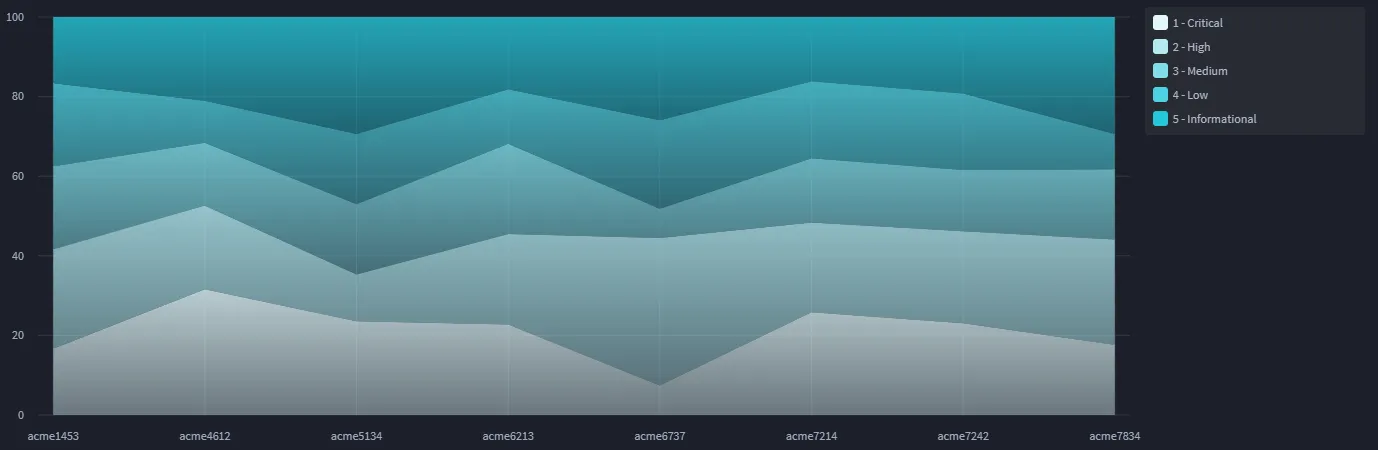
Area charts are similar to line charts. Use area charts to demonstrate trends over time.
Area
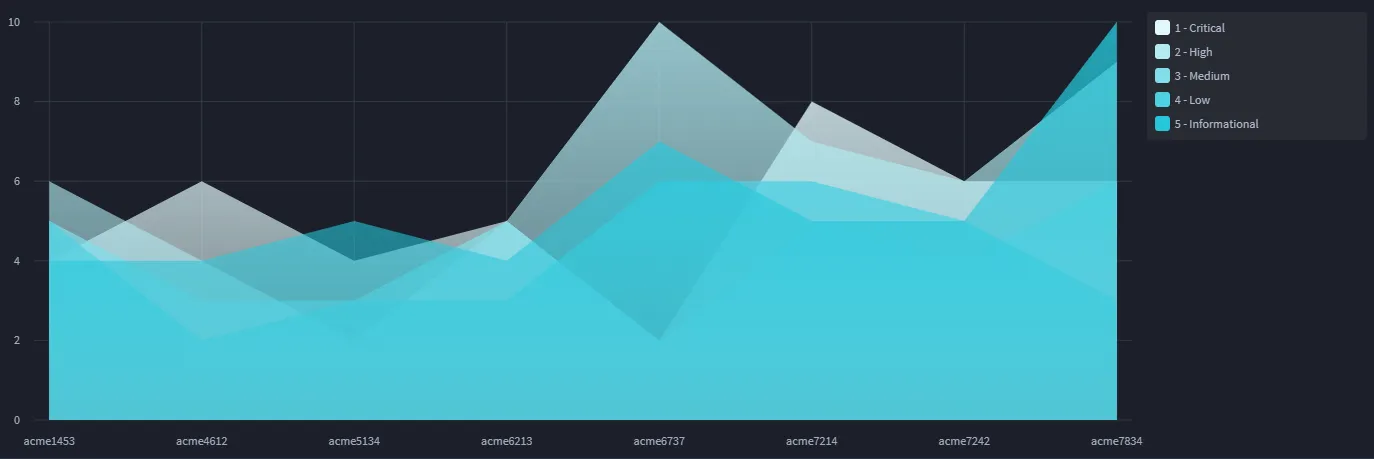
Stacked Area
100% Area
Pie Charts
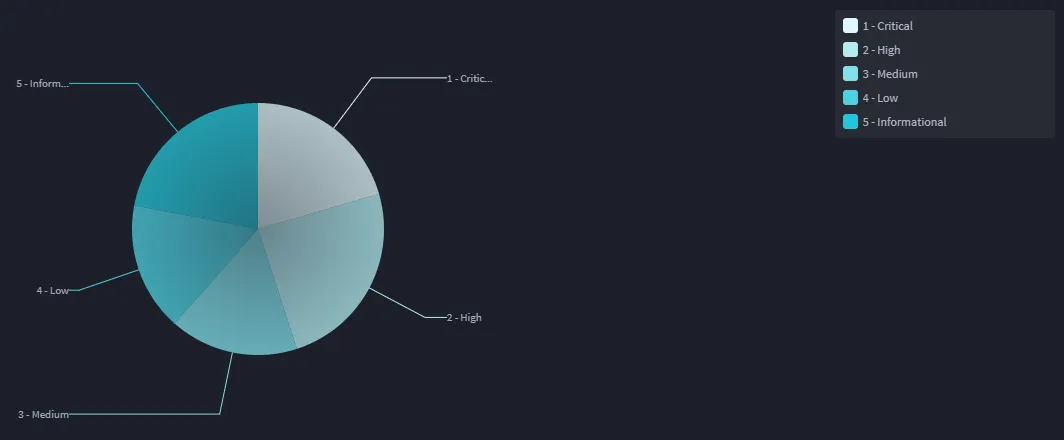
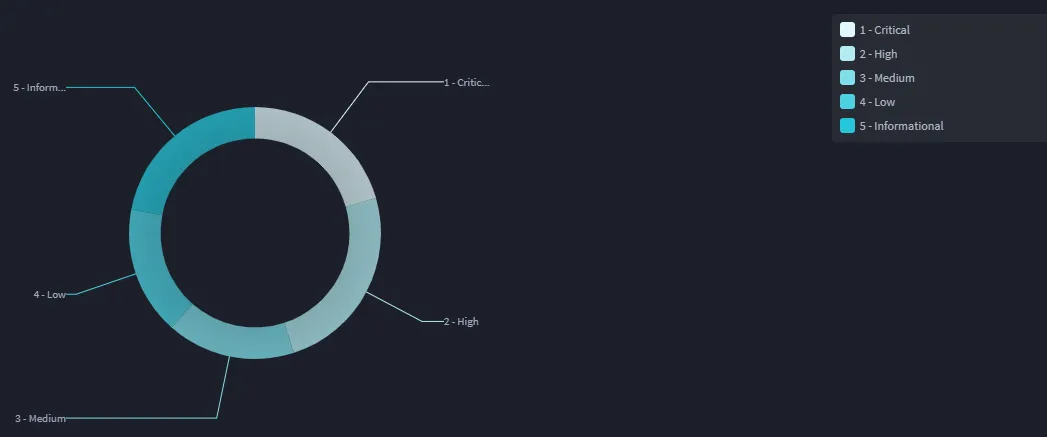
Use a pie chart when you want to display the composition of something.
Pie
Donut
Pie Grid
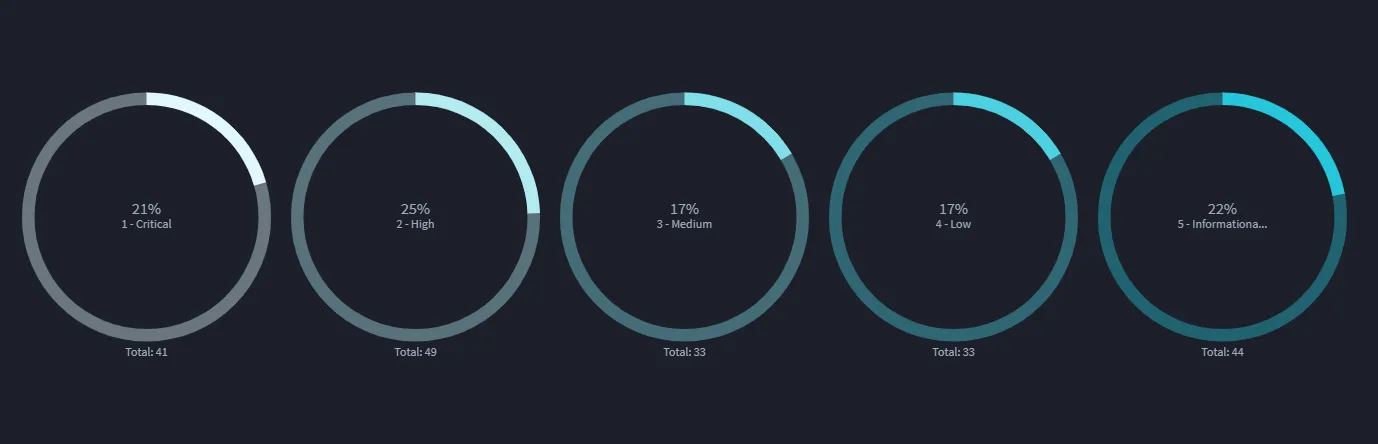
Advanced Pie
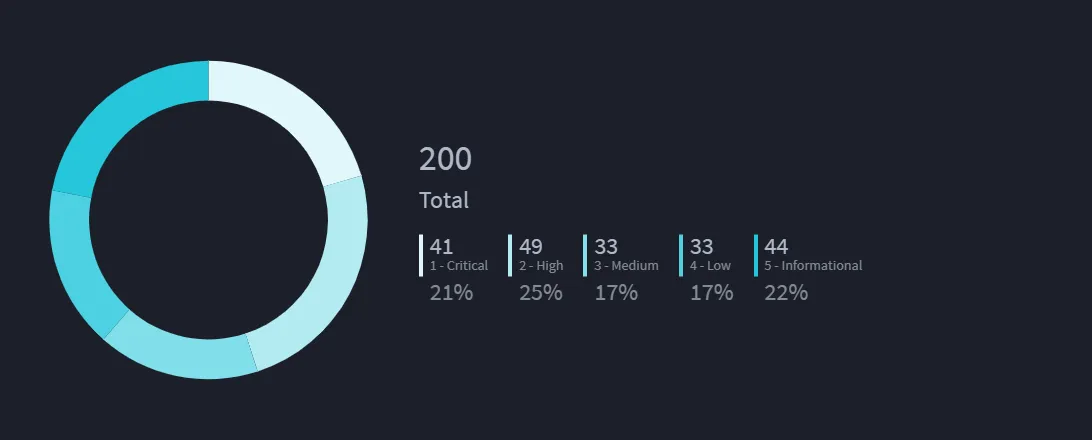
Number Card

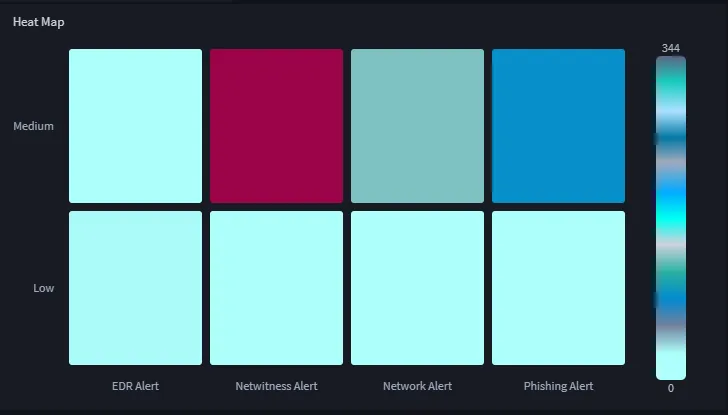
Heat Map
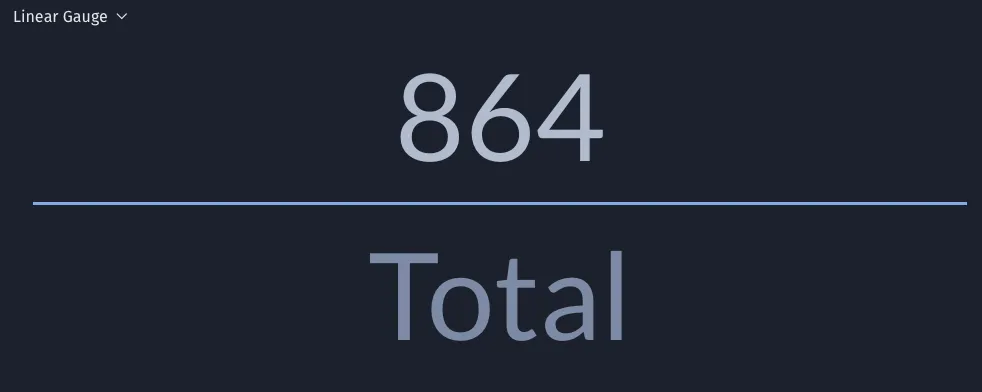
Linear Gauge
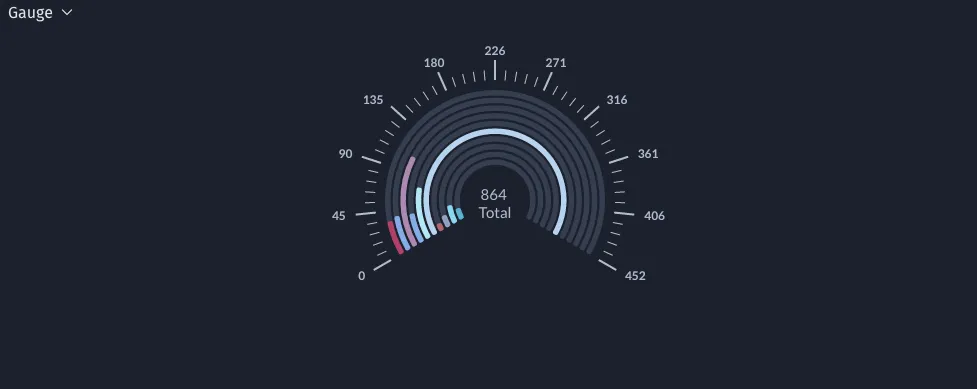
Gauge
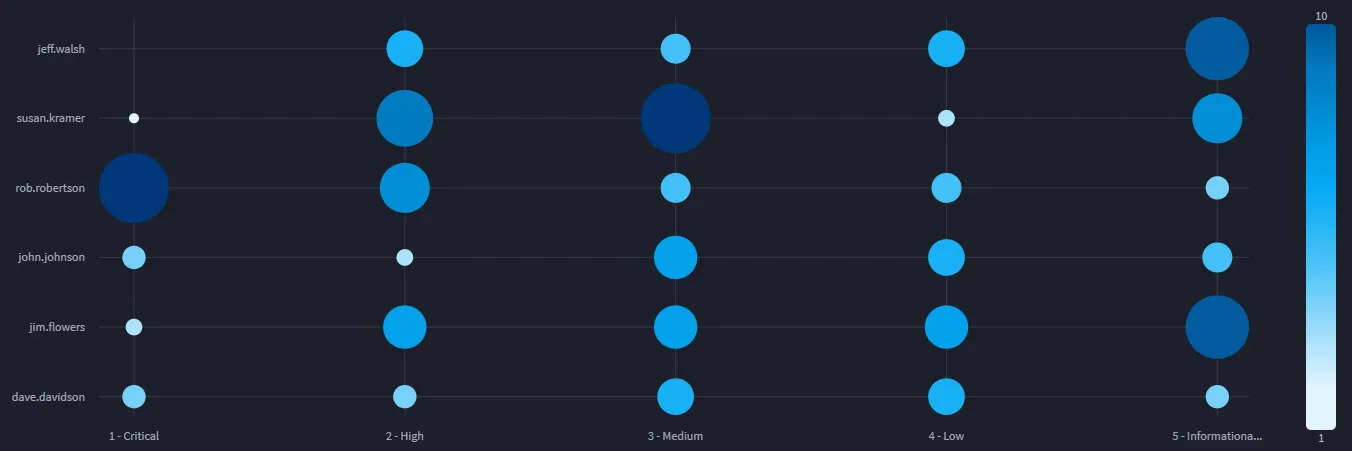
Bubble Chart
Report Widgets