Runs
The table lists individual playbook runs, grouped by playbook flow, and includes both completed and in-progress executions. Depending on the current state of execution, runs may appear as Queued, Active, Success, Fail, or other supported status types.
Overview
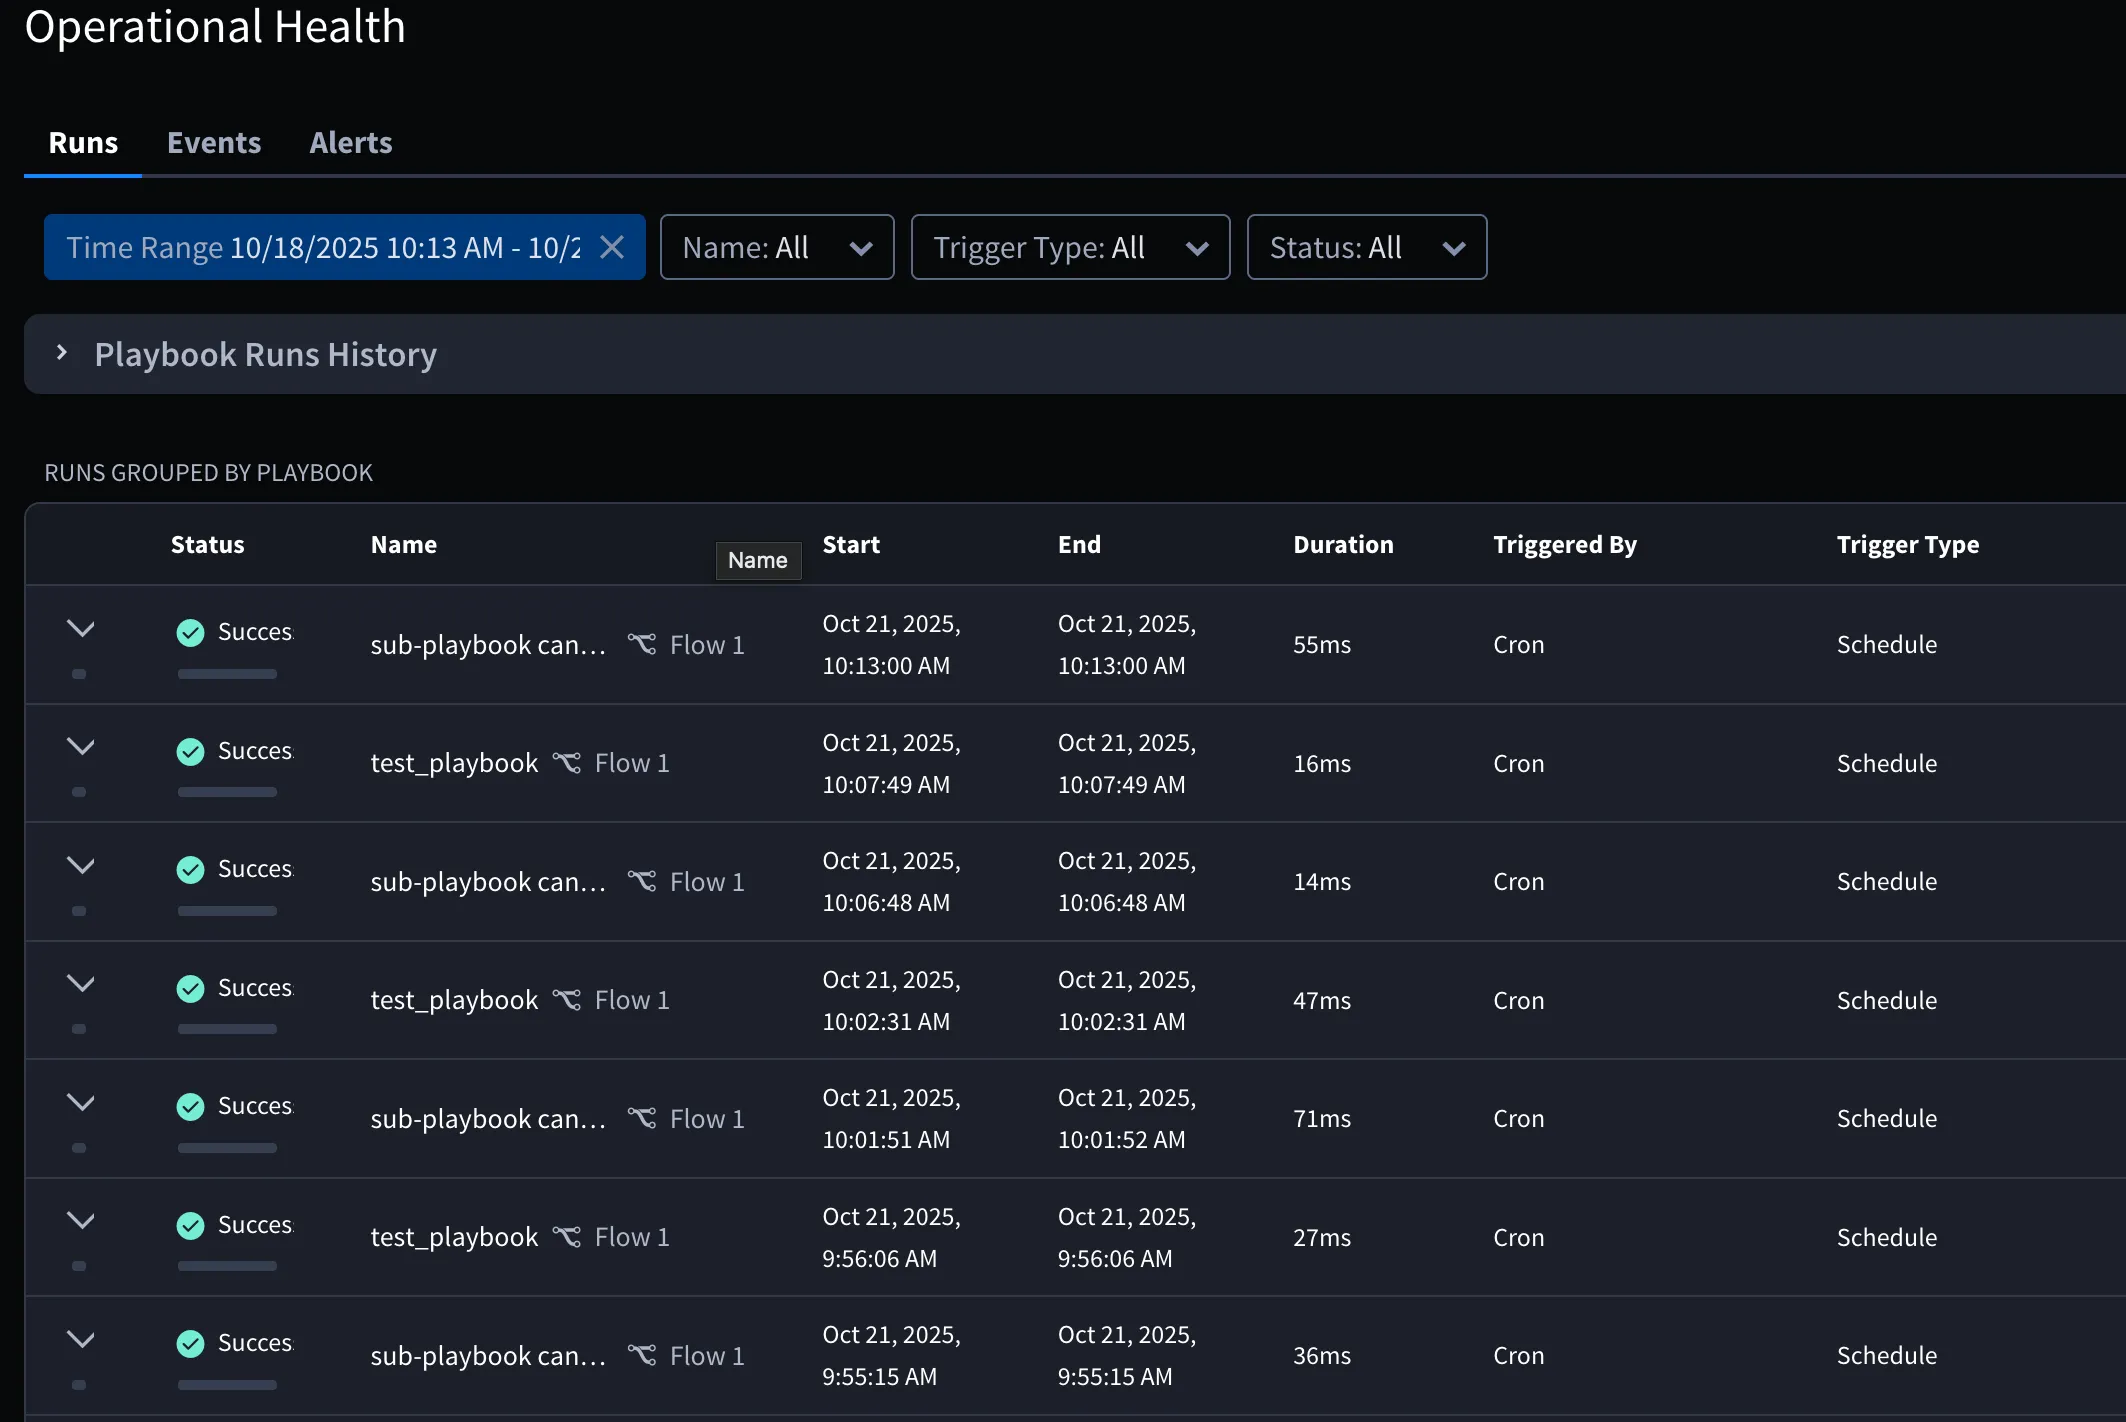
The Runs page displays a Playbook Runs History graph alongside a detailed run table. This combination allows quick identification of execution trends and operational efficiency.
- The graph shows overall playbook activity trends over time. By default, it is collapsed; click the expand icon to open it.
- The table lists individual playbook runs, grouped by playbook flow, with status indicators (green for success, red for failure).
Data Retention
Detailed playbook and component run data—including trigger data and action input/output—is retained for 14 days. After that period, detailed run data is no longer available, and runs older than the retention period are not returned in Operational Health.
Playbook Runs Overview
On this page, a graph and table display showing you the playbooks that have run recently.
By default, the graph titled Playbook Runs History is collapsed. Click the > icon to expand and view it.
The table beneath the graph shows individual playbook run records, grouped by playbook flow. For each entry, the following details are shown:
- Status: Displays the current state of the playbook run. Depending on the execution lifecycle, runs may show statuses such as Queued, Active, Success, Fail, Timeout, or Contained Errors.
- Name: Displays either a playbook flow or component name. The Name column for playbooks shows both playbook and flow names (separated by an icon), while component runs display the component name with an identifying icon. If names are too long for the column, they are truncated with ... and can be viewed in full via tooltip on hover.
- Start / End Time: Timestamps showing when the run began and completed
- Duration: Total run time in seconds and milliseconds
- Trigger by: Indicates whether the run was triggered by a playbook or by Hero AI Companion.
- Trigger Type: Mechanism that started the run
Clicking the expand arrow for a run provides deeper insights:
- Execution logs
- Error messages (if any)
- Step-by-step execution path and time taken
- Input/output data for actions within the playbook or component
A successful playbook run is indicated by a green dot, while a failed playbook run is indicated by a red dot. You can click the expand arrow in the left column for more details about any run.
Monitoring Active Playbook Runs
The Runs page provides real-time visibility into playbook execution. In addition to completed runs, you can now view playbooks that are currently queued or actively running.
When a playbook is executing:
- The run appears in the table with an Active status.
- Active runs update automatically as execution progresses.
- Expanding a run displays current execution details, including trigger information and run metadata.
- Active runs remain visible until they complete, fail, or are manually canceled.
Canceling an Active Playbook Run
If a playbook run needs to be stopped before completion, you can cancel it directly from the Runs page.
To cancel a running playbook:
- Navigate to Orchestration Health > Runs.
- Locate a playbook with an Active status.
- Expand the run using the arrow in the left column.
- Click Cancel Run.
Once canceled:
- The playbook execution stops immediately.
- The run status changes from Active to Fail.
- The run details display an error message indicating the reason for termination.
Example:
Field | Value |
|---|---|
Status | Fail |
Error | Playbook run cancelled |
Filtering Playbook Runs
To help you efficiently locate specific playbook executions, the Playbook Runs interface includes multiple filtering options:
- Filter by Date Range– Select a custom time period to view runs that occurred within a specific time window.
- Filter by Playbook Name– Narrow results to run from a particular playbook.
- Filter by Trigger Type– Choose between triggers such as Playbook Button, Record Create, Record Update or others to refine your view.
- Filter by Status– View runs based on their outcome, such as Successful or Failed.
Filter by Date Range Feature
The time range filter lets you narrow down playbook runs within a custom period using a date-time picker. In this example, the calendar allows selecting start and end dates—here, from July 14 to July 17, 2025, with precise time granularity down to the minute. Once the desired range is selected, clicking Apply updates the results to display only the relevant runs within that timeframe.
Filter by Playbook Feature
The Playbook filter enables you to narrow down the playbook run history based on specific playbook name. By clicking the dropdown next to "Playbook: All," you can view a list of all available playbooks and select one or more to focus the results. A built-in search bar allows for quick lookup of playbook names, and a Select All option is also provided for broader filtering. This feature helps you easily isolate and monitor the execution history of individual or multiple playbooks within the defined timeframe.
Filter by Trigger Type Feature
TheTrigger Type filterallows you to refine playbook run results based on how the playbook was initiated. From the dropdown menu "Trigger Type: All," you can choose from various trigger methods such asFlow Event, Playbook Button, Record Create, Record Update, Schedule, and more. ASelect Alloption is available for broader views, and a search bar makes it easy to find specific trigger types. This filtering capability is useful for analyzing runs triggered by specific actions, helping you troubleshoot or audit automation flows more effectively.
Filter by Status Feature
The Status filter allows you to view playbook runs based on their execution state or outcome. Depending on your environment and enabled features, available statuses may include:
- Queued
- Active
- Success
- Fail
- Timeout
- Contained Errors
This makes it easy to monitor currently running playbooks or investigate completed executions.
Key Benefits of Monitoring Playbook Runs
- Track Workflow Efficiency: Analyze the success rate of playbook runs to ensure automation workflows are operating efficiently.
- Identify Issues Early: Quickly spot any failed playbook runs and investigate potential issues, preventing bottlenecks in your processes.
- Optimize Performance: Use the run history to identify patterns and optimize playbooks that may be taking too long or failing under certain conditions.
Expanding Playbook Run Details
Clicking the expand arrow next to a specific playbook run provides a deeper insight into the run:
- Detailed execution logs
- Error messages (if applicable)
- Execution path and time taken for each step
- Input/output data for the actions within the playbook
By reviewing these details, you can troubleshoot issues, refine your playbook logic, and ensure smoother future runs. Detailed trigger and input/output data is available only within the 14-day retention period described in Data Retention.
Tips for Effective Monitoring
- Regular Reviews: Frequently check the Playbook Runs page to stay updated on the performance and health of your workflows.
- Focus on Patterns: Look for recurring issues or patterns in failed runs to proactively address potential problems.
- Utilize Logs: Leverage detailed logs to understand the context of any issues and refine your playbooks accordingly.