Logging
You can view Swimlane logs on the Swimlane Settings, Logging page.
You control the level at which logs are reported. Logging levels are progressive in the order seen in the table below. For example, if you have set the logging level to Info, you will receive the logging details for the Info level, as well as those for Debug, Warn, and Error. If you have set the logging level to Warn, you will only receive the logging details for Warn and Error.
Logging levels include:
Logging Level | What the level includes: |
|---|---|
Info | Audit information such as when and what user saved or updated an application or record and all levels below |
Debug | Detailed internal system information used for problem resolution and all levels below |
Warn | Warnings and all levels below |
Error | Errors when something does not complete successfully |
Use the messages from logs when contacting Swimlane support regarding an error.
Viewing Logs
To view logs:
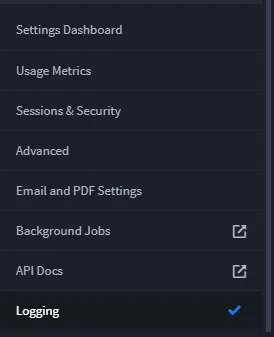
- From the navigation menu, click Logging.
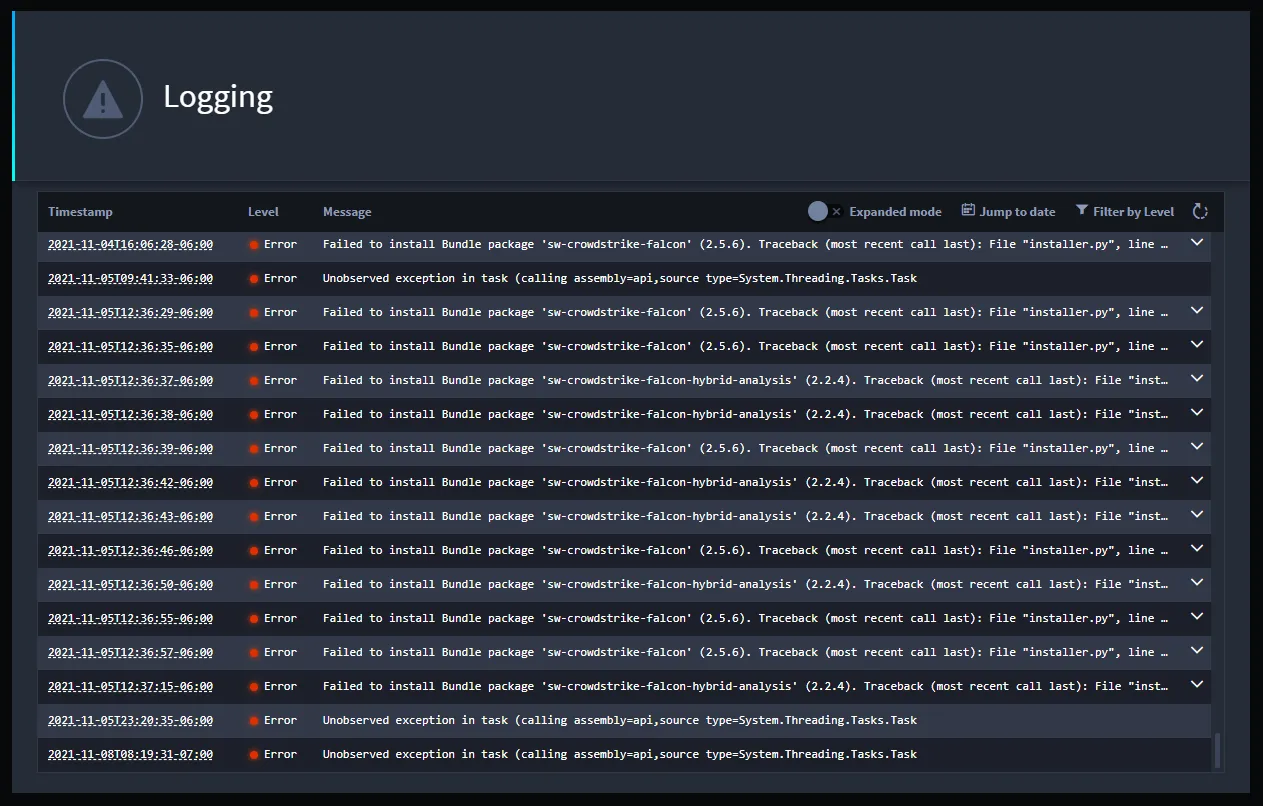
- On Logging, the log data displays.
Log Item | Description |
|---|---|
Timestamp | Lists the date and the time of the logged event. Hover over the timestamp to see the server and local/user time of the logged event. |
Level | Displays the logging level of the event. |
Message | Displays the Swimlane message for the logged event. |
Expanded Message | Expands the view of the Swimlane message. |
Jump to Date | Opens a calendar from which you can select a specific date to view logs from. |
Filter by Level | Allows you to filter the logs by level. You can select more than one level. |
Fetch | Fetches the latest logs. |
Configuring Logging Levels
You need to update the configuration for your deployment in order to set the levels for logging. Configuration is done via the SPI Admin Console.
To configure environment variables for logging levels:
- Navigate to the SPI Admin Console and open the Configuration tab.
- Navigate to the Swimlane Settings section on the Configuration page and update the Swimlane Logging Level text field. By default, the value is set to Warn. See the logging levels table above for more information about how levels report back as logs.
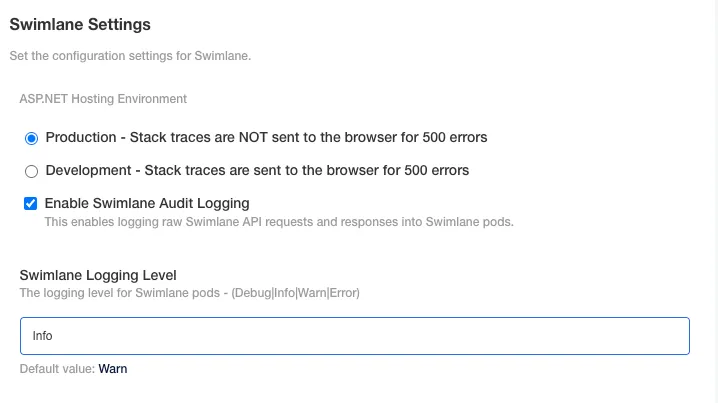
- Optionally, enable audit logging. It is required that the Swimlane Logging Level is set to Info so that all audit logs show up.
- Navigate to the bottom of the page and save your changes, you will be prompted to deploy the new configuration immediately or you can deploy it in the Version history tab at a later point in time. In the Version history tab, the latest sequence ID should correspond to the sequence ID shown on the pop up when you save the configuration changes.
Using an External API to Forward Logs
As an orchestrator, sometimes you may need to forward Swimlane logs to use in other technology. The process outlined here shows you how to forward the logs via an external API.
Swimlane has developed a reporting API that can report on log events. The reporting occurs in the order of this priority list:
- Authentication events:
- Logins, logoffs, failed logins -- direct logins as well as via SAML
- Failed Multi-factor Authentication (MFA), password changes, MFA changes (e.g., switching it off)
- SAML authentication settings
- Authentication configuration changes: modification of MFA, SAML settings.
- Authorization events (users, groups, roles):
- Changes (add, modify, delete) to users, groups, and roles
- Changes to group and role membership
- Fine-grained permission changes on groups, roles, objects
- Functional changes (add, modify, delete) to:
- Application settings, playbook configurations, workflows
- Integrations
- Application record deletions or manual modification by user (excluding data ingested by integrations or updated by playbooks)
- Settings events:
- Changes to login, authentication and password policy settings, proxy settings
- Changes to advanced configuration settings
- Email settings
- Logging
- Asset events:
- Creation
- Updates
- Deletion
Here is the outline of the API endpoint to get logs for a specific time period:
POST /logging/bulk

{
  "limit": <logs limit in response>,
  "pageNumber": <page number>,
  "level": <List of Log level(s)>,
  "from": "<from date>",
  "to": "<to date>",
  "relativeTime": "<specific value of range>",
  "SearchValue": <search value of the Log Message>
}
Use this table to further understand the payload details:
Field | Definition | Available Values |
|---|---|---|
"limit" | Limits the number of records that return for a specific page. The default is 1000. The max limit is also 1000. (optional) | a numeric value |
"pageNumber" | Based on the limit and the total number of records the report return the number of pages required to get all the records for that particular time period. You can choose which pageNumber you want to get the data from. If no pageNumber is specified, the report returns the first page. | a numeric value |
"level" | Allows you to type of logs they want to get into the third-party technology | Info, Error, Warn, Debug (Info and Warn are the default values) |
"from" and "to" | Date time in Zulu time (UTC time zone) | UTC time format: xx:xx:xxZ. Either "from" and "to" or "relativeTime" must be specified |
"relativeTime" | Time relative to the current time | 1m = last 1 minute, 1h = last 1 hour, or 1d = last 2 day, or 1w = Last 1 week and so on. Either "from" and "to" or "relativeTime" must be specified |
"searchValue" | You can search for logs with specific keywords. If you don't specify a searchValue all records are returned. If searchValue is present the logs will be filtered to those specific keywords | Application ID or Record ID |
At this time, there is no way to separate the audit logs from the other logs. You will get error logs and other logs along with audit logs.