Chart Options
The Options tab in the chart configuration panel allows customization of the chart's presentation. Different chart types have different options.
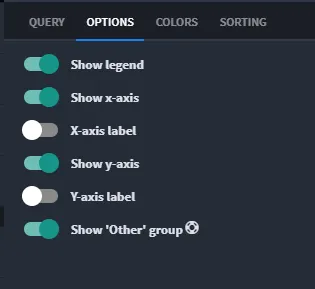
Here are the many options available to you with charts:
Chart Option | What it Does | Available With |
|---|---|---|
Show Legend | Displays a legend to the right of the chart. | all bar charts, multi-series line charts, stacked area and 100% area charts, pie and donut charts, heat map |
Show X-Axis | Displays the x-axis of the chart. | all bar charts, all line charts, all area charts, heat map |
X-Axis Label | Displays text as a label under the x-axis. | all bar charts, all line charts, all area charts, heat map |
Show Y-Axis | Displays y-axis of the chart. | all bar charts, all line charts, all area charts, heat map |
Y-Axis Label | Displays text as a label to the left of the y-axis | all bar charts, all line charts, all area charts, heat map |
Show 'Other' Group | Shows data items that do not fit on the chart, grouped together under an Other item. This option indicates whether to show that item in the chart or not. | all charts |
Auto Scale | Changes the y-axis scale from the minimum value of the measure to the maximum value of the measure. | line charts, area charts |
Show Value Labels | Displays labels on pie and donut charts. | pie and donut charts |
Show Timeline | Displays a timeline control under charts which allows the user to select a specific date interval to display on the chart. This is only available on charts that have a date field as the first dimension. | all line charts, all area charts |
Explode Slices | Displays the radius of the slices of a pie chart proportional to their size. | pie charts |
Smooth or Line Interpolation | Uses an algorithm to interpolate a smoothe curve from discrete data points. Sub-options include: Basis, Cardinal, Catmull Rom, Linear, Monotone X, Monotone Y, Natural, Step, Step After, and Step Before. | all line charts, all area charts |
Bubble | Replaces data points in the chart with bubbles, where the bubble size represents an additional dimension of data. | bubble charts |